As the old stock markets have been shut down over the Christmas/New Year season there has been a lot of time for me to take a step back and look at the long term charts. For some time I have suspected a pattern in bitcoin boom waves, and i'm not alone on this. But until now I hadn't given it to much credence. Looking at the long term gold chart however has lead to this admittedly bazaar conclusion.


There's a similarity in these precious metal charts that seems to be giving guidance for the price of bitcoin. The "boom an wobble down to boom" pattern is repeated on different time scales. It maybe caused by some kind of psychological phenomenon in relation to safe havens for value and bubbles. I'm not sure why its doing this but it seems to be repeated at least 3 times in btc and twice in gold. Considering also that trading bots are looking for repeating patterns and make up a big part of the market, I was compelled to overlay the charts.

I wouldn't want to get all Nostradamus on it, but now is the season. I feel this level of market capitalisation is reasonable so in good faith I'll time stamp my prediction for the year in the blockchain.
"I, MidwayCrypto estimate a price of $2400 by mid 2016 followed by a dip to $1400 by year end"
Bitcoin

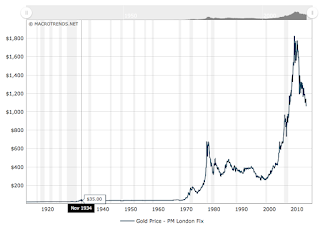
Gold

Silver

There's a similarity in these precious metal charts that seems to be giving guidance for the price of bitcoin. The "boom an wobble down to boom" pattern is repeated on different time scales. It maybe caused by some kind of psychological phenomenon in relation to safe havens for value and bubbles. I'm not sure why its doing this but it seems to be repeated at least 3 times in btc and twice in gold. Considering also that trading bots are looking for repeating patterns and make up a big part of the market, I was compelled to overlay the charts.

I wouldn't want to get all Nostradamus on it, but now is the season. I feel this level of market capitalisation is reasonable so in good faith I'll time stamp my prediction for the year in the blockchain.
"I, MidwayCrypto estimate a price of $2400 by mid 2016 followed by a dip to $1400 by year end"
No comments:
Post a Comment